
Palantir Technologies (PLTR) entered public markets in September 2020 and shot up in a sharp rally that ended quickly. The hype faded and the price sank for two full years until December 2022, when it printed a low of $5.92. That level marked a turning point.
Buyers took full control and the stock climbed non-stop for almost three years, reaching a new high near $207.52 in November 2025. The trend stayed strong for far longer than most traders expected, but the move now looks stretched. A pullback now seems likely, and a short setup finally appears.
Technical Confluences
First on the monthly chart, RSI sits near 96, the highest level Palantir ever reached. A high RSI does not always mean a stock is necessarily overbought. It can simply show strong control from buyers. A stock can even keep moving up while RSI stays elevated.
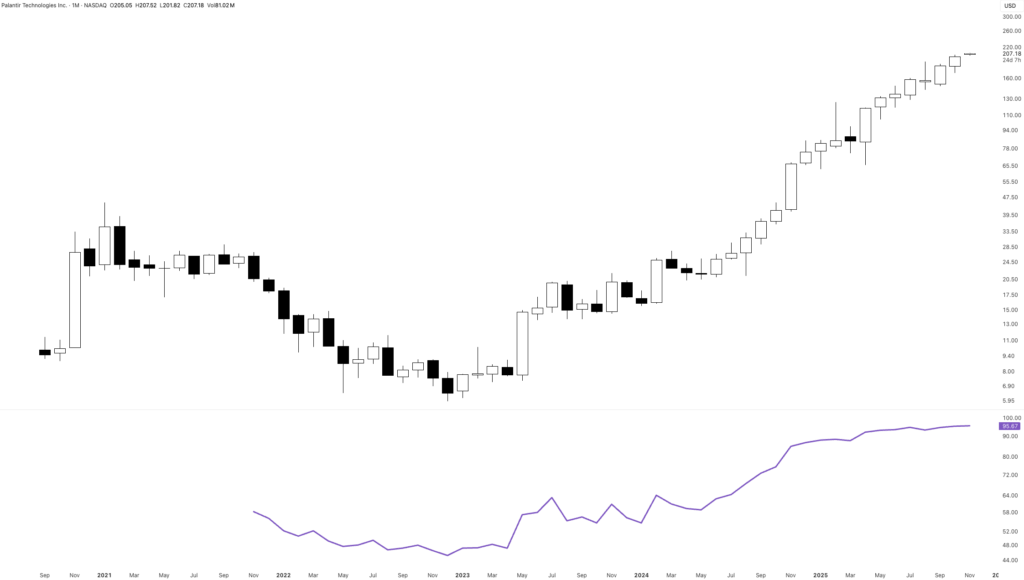
But the zone above 90 changes the picture completely. RSI between 90 and 95 almost always marks extreme conditions that rarely last. It shows a crowding effect.
Still, the monthly scale leaves room for short-term movement. Price can push a bit higher or drift sideways for a few candles. However, the bigger trend points toward a pullback. A multi-month correction now stands as the most likely outcome.
Read More: Palladium Price Prediction: A 45% Rally Awaits a Final Pullback
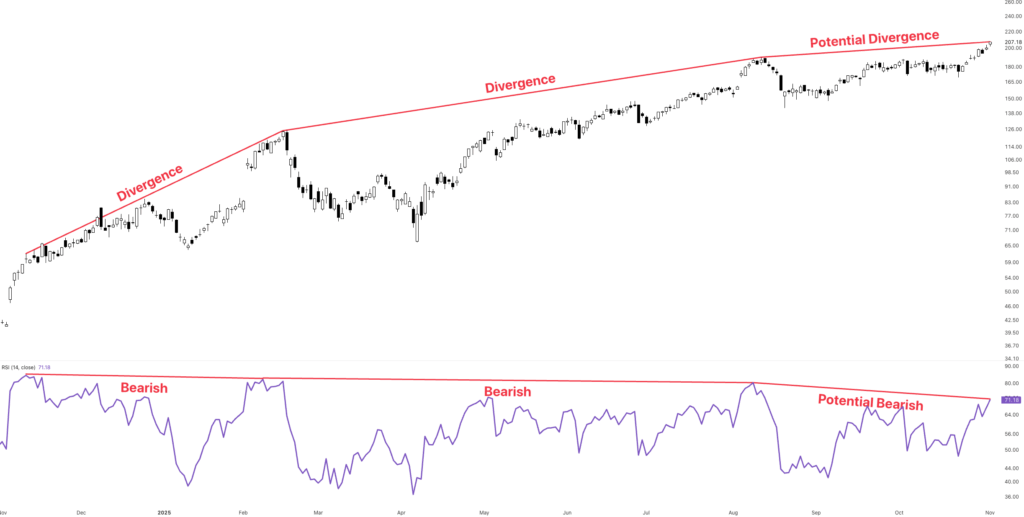
The second signal comes from the daily chart. Bearish divergence formed over several months, and momentum now lags behind price. If November closes with an RSI under 80.6, the odds of a trend break rise even more. The strong vertical push from earlier in the year no longer holds.
Another red flag is the distance from the upper Bollinger Band. Price moved far above the band, and most price action returns inside the bands after extreme spikes. A move toward the mid-band or lower band fits the current environment.
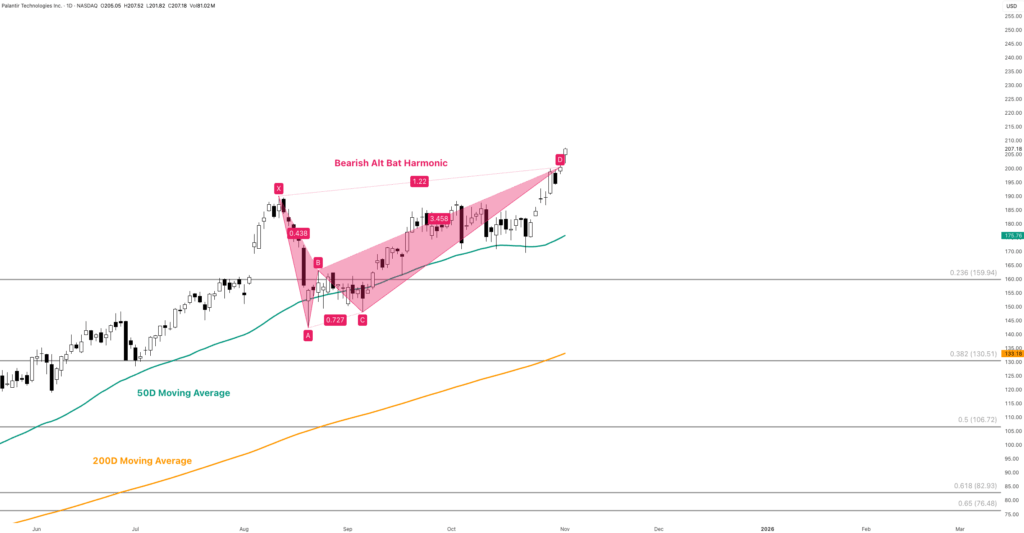
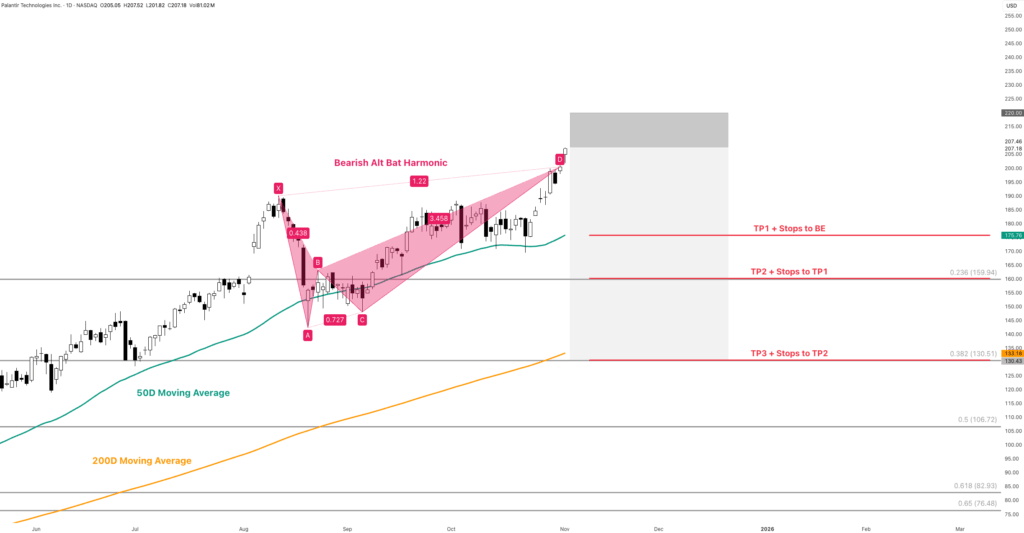
A third and final point of confluence comes from the Alt Bat harmonic pattern, which completed at $200.
Trade Plan
Short entry builds near $200–$210 with a stop at $220.
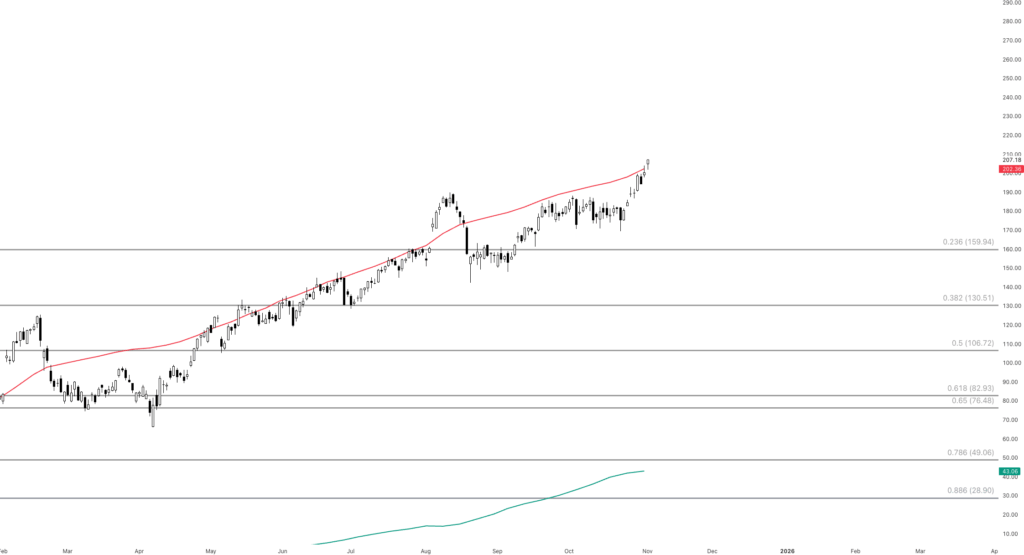
Targets follow key fib retracement levels pulled from the all-time low to the all-time high:
- Entry zone: $200-210
- Stop: $220
- Final target: $130 (0.382 + 200-day MA)
- TP1: $175 near the 50-day MA
- TP2: $160 at the 0.236 fib
- TP3: $130 at the 0.382 fib + 200-day MA
Disclaimer: The content presented herein is for informational purposes only and should not be interpreted as financial or investment advice. While efforts have been made to ensure the accuracy of the information, no guarantees are made regarding its completeness, reliability or suitability for any particular purpose. Financial markets carry inherent risks, and historical trends do not ensure future outcomes. Before making any financial decisions, we strongly advise seeking guidance from a qualified professional. The authors and publishers disclaim any liability for actions taken based on the information provided.